Operating results
* Please scroll horizontally to see.
| FY12 / 19 Linking |
FY12 / 20 Linking |
FY12 / 2021 Linking |
Fiscal year ending December 2022 Linking |
December 2023 Linking |
|||||||
|---|---|---|---|---|---|---|---|---|---|---|---|
| Actual results | Year-on-year | Actual results | Year-on-year | Actual results | Year-on-year | Actual results | Year-on-year | Actual results | Year-on-year | ||
| Amount of sales | 220,674 | -- | 213,404 | △3.3 | 226,833 | -- | 246,453 | +8.6 | 268,154 | +8.8 | |
| Gross profit | 47,034 | -- | 45,909 | △2.4 | 47,670 | -- | 52,160 | +9.4 | 57,522 | +10.3 | |
| Gross profit margin (%) | 21.3 | -- | 21.5 | -- | 21.0 | -- | 21.2 | -- | 21.5 | -- | |
| Selling, general and administrative expenses | 33,237 | -- | 34,891 | +5.0 | 34,673 | -- | 37,493 | +8.1 | 39,003 | +4.0 | |
| Sales management ratio (%) | 15.1 | -- | 16.4 | -- | 15.3 | -- | 15.2 | -- | 14.5 | -- | |
| Operating income | 13,797 | -- | 11,017 | △20.1 | 12,997 | -- | 14,667 | +12.8 | 18,519 | +26.3 | |
| Operating profit margin (%) | 6.3 | -- | 5.2 | -- | 5.7 | -- | 6.0 | -- | 6.9 | -- | |
| Ordinary income | 14,197 | -- | 11,559 | △18.6 | 13,555 | -- | 15,065 | +11.1 | 18,669 | +23.9 | |
| Ordinary rate of return (%) | 6.4 | -- | 5.4 | -- | 6.0 | -- | 6.1 | -- | 7.0 | -- | |
| Net income | 9,613 | -- | 8,007 | △16.7 | 11,596 | -- | 10,626 | △8.4 | 12,268 | +15.4 | |
| Net profit margin (%) | 4.4 | -- | 3.8 | -- | 5.1 | -- | 4.3 | -- | 4.6 | -- | |
(Unit: million yen,%)
* Consolidated results with overseas subsidiaries from 2019.
*From the beginning of 2022, we will apply the “Accounting Standard for Revenue Recognition”. Therefore, the figures for 2021 are the figures after retroactive application, and the year-on-year changes for the 60th period are comparisons with the figures for 2021 after retroactive application.
Amount of sales
2019/12 ~ "Consolidation"
Ordinary income
2019/12 ~ "Consolidation"
Net income
2019/12 ~ "Consolidation"
Financial indicators
* Please scroll horizontally to see.
| FY12 / 19 Linking |
FY12 / 20 Linking |
FY12 / 2021 Linking |
Fiscal year ending December 2022 Linking |
December 2023 Linking |
|
|---|---|---|---|---|---|
| Actual results | Actual results | Actual results | Actual results | Actual results | |
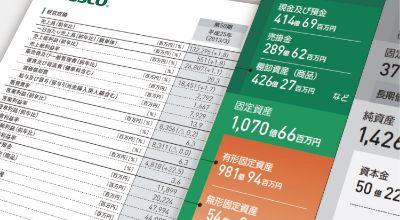
| Cash and deposits | 18,372 | 32,383 | 41,469 | 39,400 | 43,283 |
| Inventories | 43,653 | 41,542 | 42,627 | 45,292 | 50,848 |
| Total assets | 196,094 | 208,854 | 223,072 | 225,207 | 244,878 |
| net worth | 127,478 | 132,960 | 142,477 | 151,002 | 160,716 |
| Capital adequacy ratio(%) | 65.0 | 63.7 | 64.0 | 67.1 | 65.6 |
| liabilities | 68,616 | 75,894 | 80,402 | 74,205 | 84,162 |
| Total asset turnover (times) Sales / total capital |
1.1 | 1.1 | 1.1 | 1.1 | 1.1 |
| Tangible fixed asset turnover rate (times) Sales / property, plant and equipment |
2.4 | 2.3 | 2.4 | 2.5 | 2.7 |
| Inventories turnover rate (times) Sales / Inventories |
5.1 | 5.0 | 5.4 | 5.6 | 5.6 |
| ROA Total capital ordinary profit rate (%) | 7.2 | 5.7 | 6.3 | 6.7 | 7.9 |
| ROE Return on equity (%) | 7.5 | 6.1 | 8.4 | 7.2 | 7.9 |
| Number of employees at the end of the year (persons) | 2,796 | 2,786 | 2,906 | 2,954 | 3,043 |
| Staff (persons) | 1,656 | 1,674 | 1,632 | 1,639 | 1,661 |
| Part-timer (persons) | 1,128 | 1,100 | 1,264 | 1,305 | 1,370 |
(Unit: million yen,%)
Cash flow statement
* Please scroll horizontally to see.
| FY12 / 19 Linking |
FY12 / 20 Linking |
FY12 / 2021 Linking |
Fiscal year ending December 2022 Linking |
December 2023 Linking |
|
|---|---|---|---|---|---|
| Actual results | Actual results | Actual results | Actual results | Actual results | |
| Cash flow from operating activities | 10,998 | 15,068 | 15,926 | 12,178 | 14,802 |
| Cash flow from investing activities | △19,707 | △8,743 | △4,596 | △5,165 | △13,113 |
| Cash flows from financial activities | 14,558 | 7,722 | △2,243 | △9,110 | 1,932 |
| Increase / decrease in cash and cash equivalents | 5,881 | 14,014 | 9,105 | △2,049 | 3,684 |
| Initial balance of cash and cash equivalents | 12,448 | 18,330 | 32,344 | 41,449 | 39,400 |
| End-of-term balance of cash and cash equivalents | 18,330 | 32,344 | 41,449 | 39,400 | 43,085 |
(Unit: million yen,%)
Inventories, tangible fixed assets, and trade receivables
* Please scroll horizontally to see.
| FY12 / 19 Linking |
FY12 / 20 Linking |
FY12 / 2021 Linking |
Fiscal year ending December 2022 Linking |
December 2023 Linking |
||||||
|---|---|---|---|---|---|---|---|---|---|---|
| Actual results | Year-on-year | Actual results | Year-on-year | Actual results | Year-on-year | Actual results | Year-on-year | Actual results | Year-on-year | |
| Capital investment | 19,778 | — | 8,061 | △59.2 | 8,799 | +9.1 | 4,799 | △53.5 | 13,469 | +180.6 |
| Depreciation | 4,876 | — | 6,565 | +34.6 | 6,929 | +5.6 | 6,667 | △3.8 | 6,206 | △6.9 |
| Sales to sales ratio (%) | 2.2 | — | 2.2 | — | 3.0 | — | 2.7 | — | 2.3 | — |
| Total assets | 196,094 | — | 208,854 | +1.2 | 223,072 | +6.8 | 225,207 | +1.1 | 244,878 | +8.7 |
| Merchandise | 43,653 | — | 41,542 | △4.8 | 42,627 | +2.6 | 45,292 | +7.1 | 50,848 | +12.3 |
| Number of months of inventory holding (month) End-of-term inventory / Average monthly sales for the full year |
2.4 | — | 2.3 | — | 2.2 | — | 2.2 | — | 2.3 | — |
| Tangible fixed assets | 93,104 | — | 96,076 | +3.2 | 98,194 | +2.2 | 97,464 | △0.7 | 104,569 | +7.3 |
| Tangible fixed asset turnover rate (times) Full-year sales / Full-year average property, plant and equipment |
2.4 | — | 2.3 | — | 2.4 | — | 2.5 | — | 2.7 | — |
| Trade receivables | 26,340 | — | 27,555 | △2.4 | 31,095 | +12.8 | 34,316 | +10.4 | 37,143 | +8.2 |
| Number of months of holding trade receivables (month) Year-end trade receivables / Average monthly sales for the full year |
1.5 | — | 1.4 | — | 1.6 | — | 1.7 | — | 1.7 | — |
| Amount of sales | 220,674 | — | 213,404 | △3.3 | 229,342 | +7.5 | 246,453 | +8.6 | 268,154 | +8.8 |
(Unit: million yen,%)
Information per share
* Please scroll horizontally to see.
| FY12 / 19 Linking |
FY12 / 20 Linking |
FY12 / 2021 Linking |
Fiscal year ending December 2022 Linking |
December 2023 Linking |
||||||
|---|---|---|---|---|---|---|---|---|---|---|
| Actual results | YoY | Actual results | YoY | Actual results | YoY | Actual results | YoY | Actual results | YoY | |
| Per share Net income (yen) |
145 yen 78 sen |
— | 121 yen 43 sen |
△ 24 yen 35 sen |
175 yen 97 sen |
54 yen 54 sen |
161 yen 15 sen |
△14 yen 71 sen |
186 yen 05 sen |
24 yen 90 sen |
| Per share Net assets (yen) |
1,933 yen 13 sen |
— | 2,016 yen 28 sen |
+83 yen 15 sen |
2,163 yen 55 sen |
+147 yen 27 sen |
2,289 yen 92 sen |
+126 yen 37 sen |
2,437 yen 26 sen |
+147 yen 34 sen |
| Per share Dividend (yen) |
36.50 yen | — | 30.50 yen | — | 35.50 yen | — | 40 yen | — | 46 yen 50 sen | — |
| Mid-term Dividend (yen) |
18.50 yen | — | 16.50 yen | — | 20 yen | — | 16.50 yen | — | 23 yen | — |
| Dividend payout ratio (%) Dividend / per share Net income |
25.00% | — | 25.12% | — | 20.17% | — | 24.8% | — | 25.0% | — |
| Sales (million yen) | 220,674 | — | 213,404 | △3.3 | 229,342 | +7.5 | 246,453 | +8.6 | 268,154 | +8.8 |
| Net income (million yen) | 9,613 | — | 9,613 | △16.7 | 11,603 | +44.9 | 10,626 | △8.4 | 12,268 | +15.4 |
(Unit: million yen,%)
1. Net income per share is calculated based on the number of shares outstanding during the period minus the average number of treasury stock during the period. (Based on number of shares after stock split)
2. Net assets per share is calculated based on the number of shares after deducting the number of treasury stock from the total number of issued shares at the end of the period. (Based on number of shares after stock split)
Net income per share (yen)
2019/12 ~ "Consolidation"
Net assets per share (yen)
2019/12 ~ "Consolidation"
Other information
* Please scroll horizontally to see.
| FY12 / 19 Linking |
FY12 / 20 Linking |
FY12 / 2021 Linking |
Fiscal year ending December 2022 Linking |
December 2023 Linking |
|
|---|---|---|---|---|---|
| Actual results | Actual results | Actual results | Actual results | Actual results | |
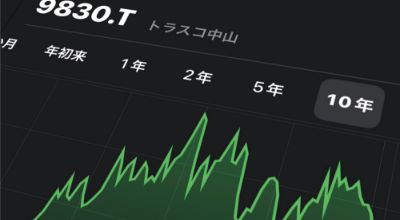
| Year-end stock price (yen) [TSE end of December] | 2,802 | 2,897 | 2,731 | 2,035 | 2,446 |
| High price within the year (yen) [TSE] | 3,180 | 2,978 | 3,125 | 2,793 | 2,685 |
| Low price within the year (yen) [TSE] | 2,192 | 1,739 | 2,539 | 1,654 | 1,925 |
| Price earnings ratio PER (double) Year-end stock price / net income per share |
19.2 | 19.9 | 15.5 | 12.6 | 12.8 |
| Price-to-book value ratio PBR (times) Year-end stock price / net assets per share |
1.45 | 1.44 | 1.27 | 0.89 | 1.00 |
(Unit: million yen,%)
