


【連結】2025年 12月期 四半期業績(累計)
経営成績
※横にスクロールしてご覧ください。
| 2025年12月期 第1四半期 1/1~3/31 |
2025年12月期 第2四半期 1/1~6/30 |
2025年12月期 第3四半期 1/1~9/30 |
2025年12月期 第4四半期 1/1~12/31 |
|||||
|---|---|---|---|---|---|---|---|---|
| 実績 | 前期比 | 実績 | 前期比 | 実績 | 前期比 | 実績 | 前年比 | |
| 売上高 | 79,164 | +10.1 | ||||||
| 売上総利益 | 16,610 | +12.1 | ||||||
| 売上総利益率(%) | 21.0 | - | ||||||
| 販売費及び一般管理費 | 10,766 | +9.7 | ||||||
| 販売管理費率(%) | 13.6 | - | ||||||
| 営業利益 | 5,843 | +16.9 | ||||||
| 営業利益率(%) | 7.4 | - | ||||||
| 経常利益 | 5,817 | +14.8 | ||||||
| 経常利益率(%) | 7.3 | - | ||||||
| 親会社株主に帰属する 四半期/中間期/当期純利益 |
4,002 | +13.9 | ||||||
| 親会社株主に帰属する 四半期/中間期/当期純利益率(%) |
5.1 | - | ||||||
| 決算短信 ダウンロード |
||||||||
(単位:百万円、%)
(注)2019年12月期より、タイ・インドネシア子会社との連結決算を開始いたしました。上記の経営成績は連結決算の実績を開示しています。
ルート別売上高
※横にスクロールしてご覧ください。
| 2024年12月期 第1四半期 1/1~3/31 |
2024年12月期 第2四半期 1/1~6/30 |
2024年12月期 第3四半期 1/1~9/30 |
2024年12月期 第4四半期 1/1~12/31 |
|||||
|---|---|---|---|---|---|---|---|---|
| 実績 | 前期比 | 実績 | 前期比 | 実績 | 前期比 | 実績 | 前年比 | |
| ファクトリールート | 53,281 | +8.9 | ||||||
| 機械工具商 | 25,515 | +7.4 | ||||||
| 溶接材料商 | 7,144 | +5.9 | ||||||
| その他の製造業関連 | 9,155 | +9.2 | ||||||
| 建設関連 | 11,465 | +14.1 | ||||||
| eビジネスルート | 18,545 | +13.5 | ||||||
| ホームセンタールート | 6,586 | +11.2 | ||||||
| 海外ルート | 751 |
+4.9 |
||||||
| 合計 | 79,164 | +10.1 | ||||||
(単位:百万円、%)
(注)2019年12月期より、タイ・インドネシア子会社との連結決算を開始いたしました。上記の経営成績は連結決算の実績を開示しています。
ルート別売上高構成比2025年12月期
-
ファクトリールート
67.3% -
eビジネスルート
23.4% -
ホームセンタールート
8.3% -
海外ルート
1.0%
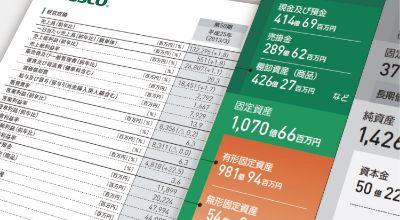
財務指標
※横にスクロールしてご覧ください。
| 2025年12月期 第1四半期 3/31現在 |
2025年12月期 第2四半期 6/30現在 |
2025年12月期 第3四半期 9/30現在 |
2025年12月期 第4四半期 12/31現在 |
|
|---|---|---|---|---|
| 実績 | 実績 | 実績 | 実績 | |
| 現金及び預金 | 59,078 | |||
| 棚卸資産 | 56,701 | |||
| 総資産 | 293,376 | |||
| 純資産 | 175,737 | |||
| 自己資本比率(%) | 59.9 | |||
| 負債 | 117,638 | |||
| 従業員数(人) | 3,183 | |||
| 内役員 | 11 | |||
| 内正社員 | 1,710 | |||
| 内パートタイマー | 1,462 |
(注)パートタイマーの人数は、実際の雇用人数です。
(注)2019年12月期より、タイ・インドネシア子会社との連結決算を開始いたしました。財務指標は連結決算の実績を開示しています。
キャッシュ・フロー計算書
※横にスクロールしてご覧ください。
| 2025年12月期 第1四半期 3/31現在 |
2025年12月期 第2四半期 6/30現在 |
2025年12月期 第3四半期 9/30現在 |
2025年12月期 第4四半期 12/31現在 |
|
|---|---|---|---|---|
| 実績 | 実績 | 実績 | 実績 | |
| 営業活動によるキャッシュ・フロー | 2,983 | |||
| 投資活動によるキャッシュ・フロー | △8,357 | |||
| 財務活動によるキャッシュ・フロー | 23,164 | |||
| 現金及び現金同等物の増減額 | 17,741 | |||
| 現金及び現金同等物の期首残高 | 41,135 | |||
| 現金及び現金同等物の四半期残高 | 58,876 |
(注)2019年12月期より、タイ・インドネシア子会社との連結決算を開始いたしました。キャッシュ・フロー計算書は連結決算の実績を開示しています。
商品分類別売上高
※横にスクロールしてご覧ください。
| 2025年12月期 第1四半期 1/1~3/31 |
2025年12月期 第2四半期 1/1~6/30 |
2025年12月期 第3四半期 1/1~9/30 |
2025年12月期 第4四半期 1/1~12/31 |
|||||
|---|---|---|---|---|---|---|---|---|
| 実績 | 前期比 | 実績 | 前期比 | 実績 | 前期比 | 実績 | 前年比 | |
| 切削工具 | 2,283 | +4.1 | ||||||
| 生産加工用品 | 6,063 | +13.3 | ||||||
| 工事用品 | 9,238 | +9.7 | ||||||
| 作業用品 | 13,893 | +8.0 | ||||||
| ハンドツール | 13,749 | +10.5 | ||||||
| 環境安全用品 | 14,700 | +16.5 | ||||||
| 物流保管用品 | 7,788 | +2.0 | ||||||
| 研究管理用品 | 3,079 | +4.9 | ||||||
| オフィス住設用品 | 7,726 | +10.9 | ||||||
| その他 | 442 | +53.7 | ||||||
| 合計 | 78,966 | +10.1 | ||||||
(単位:百万円、%)
(注)2019年12月期より、タイ・インドネシア子会社との連結決算を開始いたしました。但し、上記の商品分類別売上高の実績はトラスコ中山株式会社【単体】での開示となります。
商品分類別売上構成比2025年12月期
-
切削工具
2.9% -
生産加工用品
7.7% -
工事用品
11.7% -
作業用品
17.6% -
ハンドツール
17.4% -
環境安全用品
18.6% -
物流保管用品
9.9% -
研究管理用品
3.9% -
オフィス住設用品
9.8% -
その他
0.5%
1株あたり情報
※横にスクロールしてご覧ください。
| 2025年12月期 第1四半期 |
2025年12月期 第2四半期 |
2025年12月期 第3四半期 |
2025年12月期 第4四半期 |
|
|---|---|---|---|---|
| 1株当たり四半期純利益 | 60円69銭 |
(注)2019年12月期より、タイ・インドネシア子会社との連結決算を開始いたしました。1株あたり情報は連結決算の実績を開示しています。